需求
windows指定进程监控: 包括 QT 客户端软件和 Java 进程 的内存/句柄数等指标
windows_exporter
.\windows_exporter-0.30.6-amd64.exe --collectors.enabled=cpu,cs,logical_disk,net,os,service,system,textfile,process --collector.process.include="(java|Ecenter|).*"
启动后访问 metrics 搜索 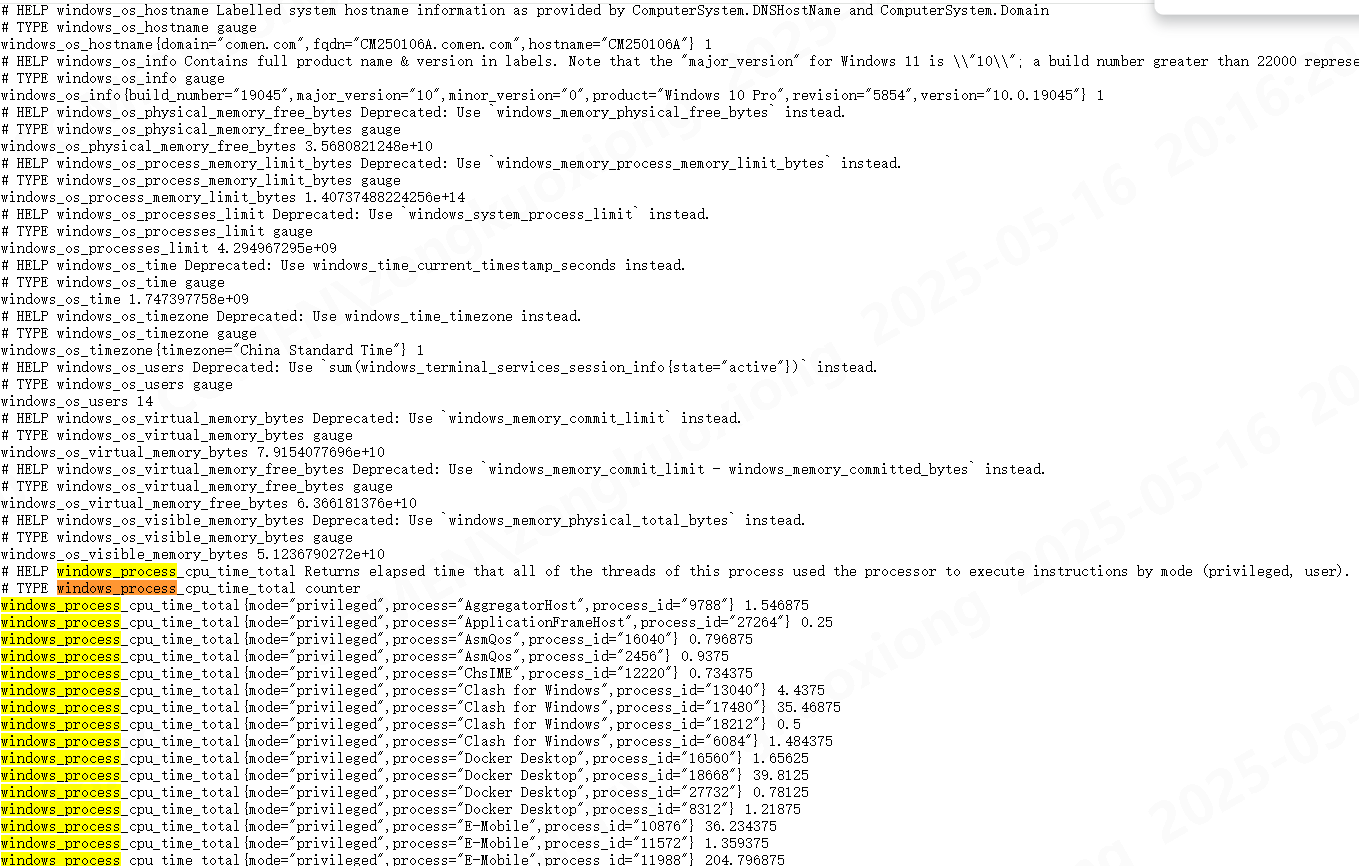
prometheus/grafana
prometheus.yml
yaml
scrape_configs:
  - job_name: 'windows'
    static_configs:
      - targets: [ '127.0.0.1:9182' ]
yaml
version: '3'
services:
  prometheus:
    image: prom/prometheus
    ports:
      - "9090:9090"
    volumes:
      - ./prometheus.yml:/etc/prometheus/prometheus.yml
  grafana:
    image: grafana/grafana
    ports:
      - "3000:3000"
配置
- 新增
prometheus数据源 Prometheus server URL :http://127.0.0.1:9090 - 导入 dashboard 20763
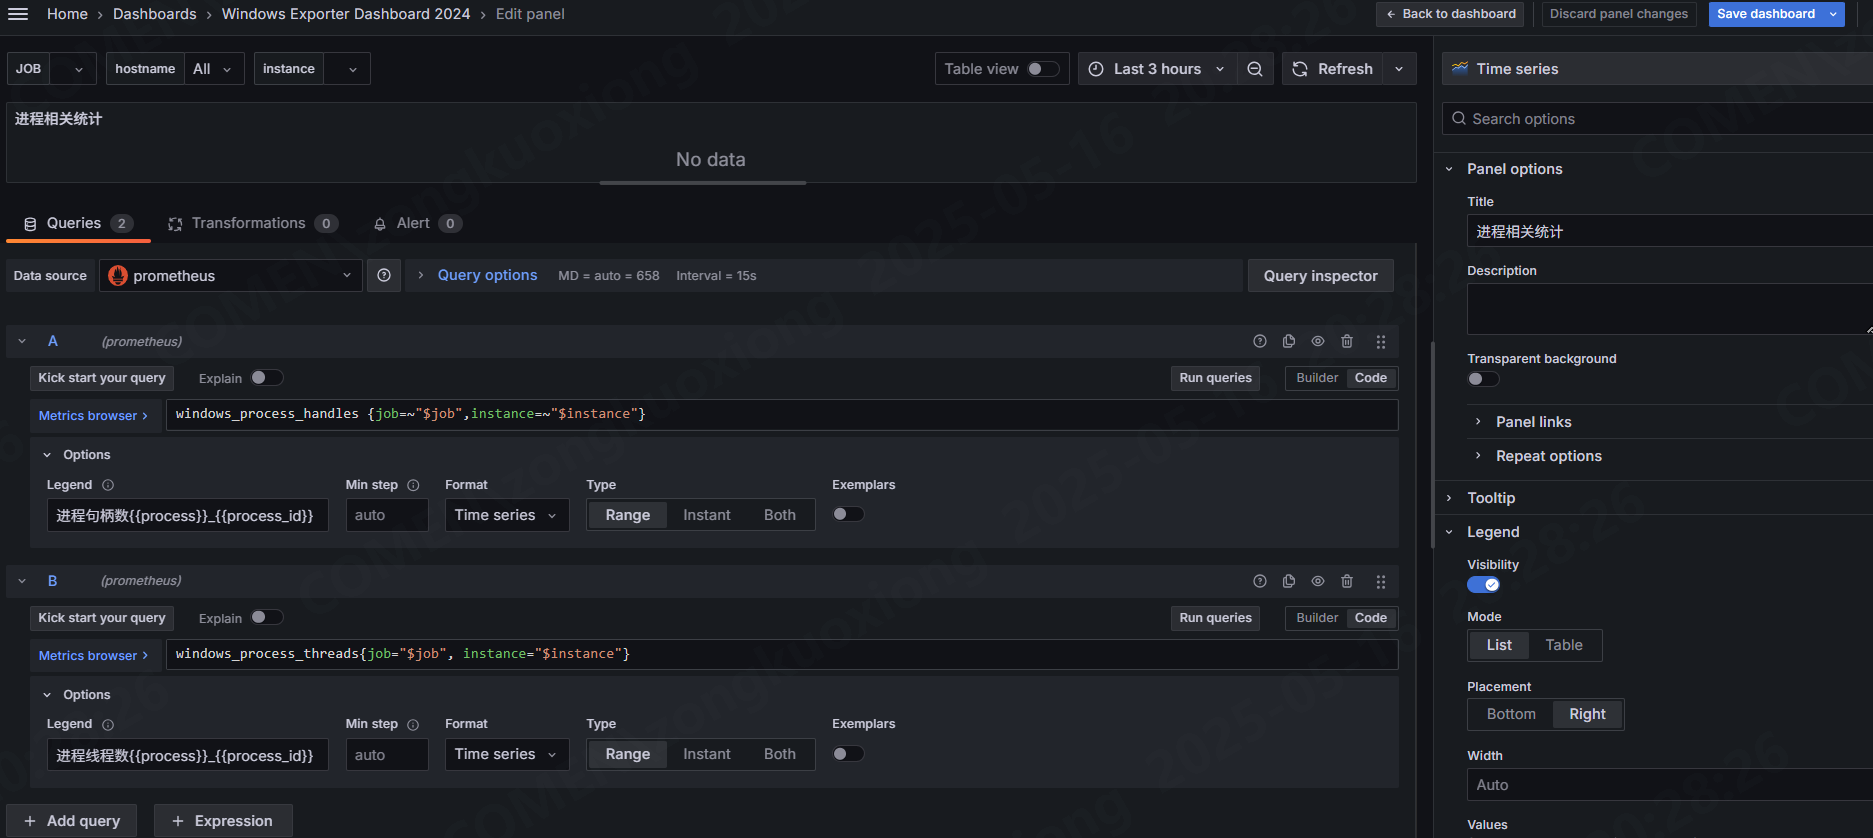
- 新增卡片
json
{
"id": 15,
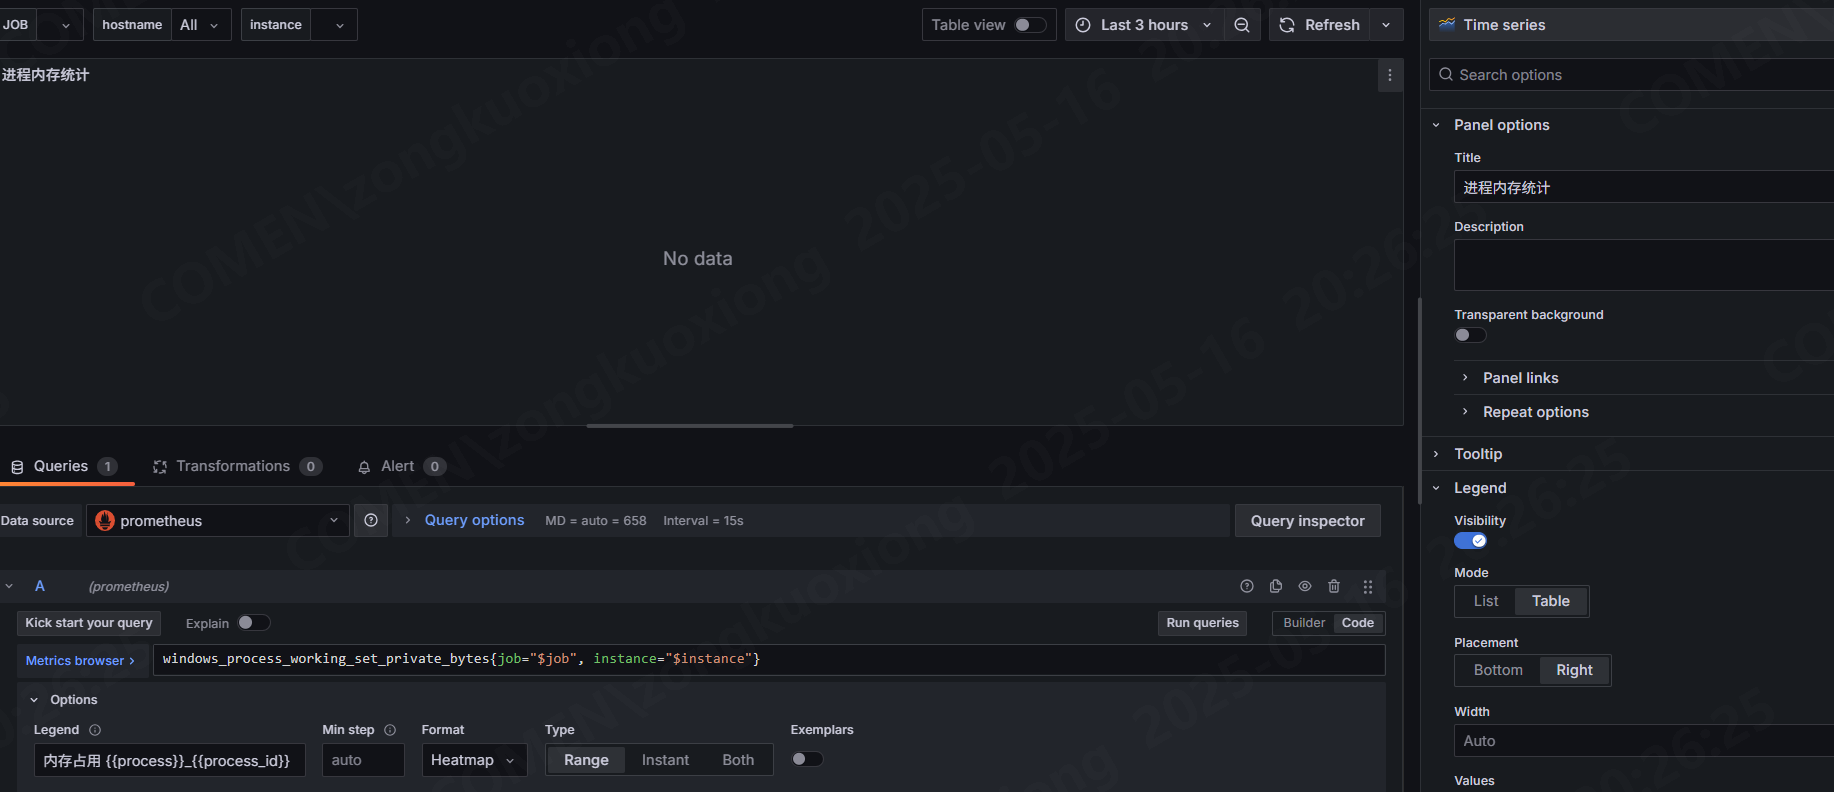
"type": "timeseries",
"title": "进程内存统计",
"gridPos": {
"x": 0,
"y": 8,
"h": 8,
"w": 12
},
"fieldConfig": {
"defaults": {
"custom": {
"drawStyle": "line",
"lineInterpolation": "linear",
"barAlignment": 0,
"barWidthFactor": 0.6,
"lineWidth": 2,
"fillOpacity": 0,
"gradientMode": "none",
"spanNulls": false,
"insertNulls": false,
"showPoints": "never",
"pointSize": 5,
"stacking": {
"mode": "none",
"group": "A"
},
"axisPlacement": "auto",
"axisLabel": "",
"axisColorMode": "text",
"axisBorderShow": false,
"scaleDistribution": {
"type": "linear"
},
"axisCenteredZero": false,
"hideFrom": {
"tooltip": false,
"viz": false,
"legend": false
},
"thresholdsStyle": {
"mode": "line"
},
"axisWidth": -1
},
"color": {
"mode": "palette-classic"
},
"mappings": [],
"thresholds": {
"mode": "absolute",
"steps": [
{
"color": "green",
"value": null
}
]
},
"links": [],
"min": 0,
"unit": "bytes"
},
"overrides": []
},
"pluginVersion": "11.4.0",
"targets": [
{
"application": {
"filter": ""
},
"datasource": {
"type": "prometheus",
"uid": "dea58zs5ggkjkc"
},
"disableTextWrap": false,
"editorMode": "code",
"exemplar": false,
"expr": "windows_process_working_set_private_bytes{job=\"$job\", instance=\"$instance\"}",
"format": "heatmap",
"fullMetaSearch": false,
"functions": [],
"group": {
"filter": ""
},
"hide": false,
"host": {
"filter": ""
},
"includeNullMetadata": true,
"instant": false,
"interval": "",
"intervalFactor": 1,
"item": {
"filter": ""
},
"legendFormat": "内存占用 {{process}}_{{process_id}}",
"metric": "mysql_global_status_questions",
"mode": 0,
"options": {
"showDisabledItems": false
},
"range": true,
"refId": "A",
"step": 20,
"useBackend": false
}
],
"datasource": {
"type": "prometheus",
"uid": "dea58zs5ggkjkc"
},
"options": {
"tooltip": {
"mode": "multi",
"sort": "desc"
},
"legend": {
"showLegend": true,
"displayMode": "table",
"placement": "right",
"calcs": [
"lastNotNull"
]
},
"alertThreshold": true
}
}